
The exam will be a Quiz on Canvas.
The Exam is NOT open book.
ANY cheating, use of notes, text, or communication during the exam will result in a “0” on the exam and an “F” in the course. The exam will be monitored by Zoom.
As per College policy, the exam uses a lockdown browser. Details for the Lock down browser are on the UBC Canvas site, and here: https://rossway.net/lockdown-browser/
I have posted a Respondus Test Quiz – PLEASE take it to make sure your tech works. This will save you stress during the exam.
You will be monitored by Zoom (using a second device like your phone, showing you and your desk). You must be on the Zoom call and keep your CAMERA ON at all times. Please keep your MICROPHONE OFF.
- I will ask you to show your faced clearly on Zoom at the beginning of the exam.
- I will ask you to pan around your exam space at the beginning of the exam.
- During the exam, please have your camera to the side showing your face and your desk.
Remember you are studying in Catholic learning environment and are expected to behave by standards of Christian morality and ethics.
The exam covers chapters 1, 12-15 (4CE) or 1, 11-13 (3CE), the online notes 1, 12-15
Know some things including (this is NOT an exhaustive list!) …
- weathering
- volcanoes (including the various types)
- rivers and erosion
- types of mass movement
- faults (including the various types)
- rock stress strain and surfaces
- anticlines, synclines, folding, and faulting
- the 3 main different classes of rocks (igneous, sedimentary, metamorphic)
- the basic structure of the earth
- latitude and longitude
- slopes and mass movement
- types of equilibrium in systems
- how to read an NTS map (grid references, scales, etc – NOT all the individual symbols for churches, schools, etc). See the notes, below, with some of the introductory comments from the labs.
How to Study …
- The College provides study resources. Check them out.
- Read over the online notes. The exam is based on them.
- Make your own notes based on what you read.
- Quiz yourself.
- Use the questions at the end of each chapter in the text as a guide to study
- Make up your own questions to test yourself
- Use flashcards for key terms and concepts
- As you read the notes, do use the figures in the text (an online resources) as references. The figures/pictures really help you visualize what you’re studying.
- Review the chapters in the text. Note that I will NOT ask you anything that is only in the text, but not in your notes
You can NOT use your notes, my notes, or the text during the exam. Doing so will mean an automatic 0 and will be referred to the Dean for further discipline.
What Should You Bring or NOT Bring?
You should bring … Yourself! (refreshed, relaxed, invigorated)
You should NOT bring …
- Your text or notes (sorry, this exam is not open book)
- Your cousin (a geography graduate student at Cambridge)
- A calculator (any math will be VERY simple)
- Another cell phone, iphone, tablet, netbook, desktop, or other electronic device other than what you need for Zoom
- Any crib notes, cheat sheets, or other “aids”
You’ll do fine! That’s about it! Study hard! I know there is lots to know and lots to memorize (the plague of introductory science courses!), but go at it!
Bruce
*** Here are some of the introductory notes from Labs 1-3 which may be helpful (unfortunately I am unable to open the labs for you) ***
Lab 1
Scale
In order to represent any portion of the earth’s surface on a map or to produce usable photos and images, a ratio or scale must be used to reduce all distances. Obviously maps are not (normally) life-sized! They are reductions on reality! They are models. The scale on a map, photo or image gives the ratio of any length measured on the map to the corresponding actual distance on the ground. Scale refers to the relationship between distance on a map and distance on the ground.
At a scale of 1:100 000, 1 cm on the map represents 100 000 cms on the ground (which is 1 km – to convert from a big number in centimetres to kilometres, move the decimal point 5 places to the left, so 100,000 cms = 1.00000 kms or simply 1 km)
Large-scale maps cover small areas in great detail (i.e. large amount of detail). They have larger fractions.
e.g. 1:10 000 (a city map)
Small-scale maps cover large areas in less detail (i.e. small amount of detail). They have smaller fractions:
e.g. 1:10 000 000 (a world map)
At first this sounds backwards! How can 1:10 000 be a larger scale than 1:10 000 000? Because these are fractions (remember fractions!)! 1:10 000 is like 1/10000 – it is a BIGGER fraction (a bigger piece of pie) than 1/10000000 (1:10 000 000) … this would be a very SMALL piece of pie!
Scale is expressed three ways…
1. as a representative fraction (e.g. 1:100 000)
2. as a verbal statement (e.g. 1 cm on the map is 100 000 cm or 1 km on the ground)
*** Always specify “on the map” or “on the ground” so I know you know what you’re talking about! ***
3. in graphic form

Recall that large-scale maps cover small areas in great detail (i.e. large amount of detail). They have larger fractions.
e.g. 1:25 000 (a city map)
Small-scale maps cover large areas in less detail (i.e. small amount of detail). They have smaller fractions:
e.g. 1:25 000 000 (a world map)
At first this sounds backwards! How can 1:10 000 be a larger scale than 1:10 000 000? Because these are fractions (remember fractions!)! 1:10 000 is like 1/10000 – it is a BIGGER fraction (a bigger piece of pie) than 1/10000000 (1:10 000 000) … this would be a very SMALL piece of pie!
Distance
Closely related to scale is distance. In order to tell real world distances, you must measure distances on a map and convert using the scale. The two maps you are using are at a scale of 1:50 000. From the previous section you know that 1 cm on the map is equal to 500 metres or 0.5 km on the ground.
Lab 2
Mapmakers (cartographers) use a variety of “techniques” and “tricks” to make maps more usable, and to represent a lot of information simply and clearly. Today’s lab focuses on the methods cartographers use to locate places or features easily (coordinate systems) and to represent features clearly (symbols).
- Coordinate Systems
To make maps useful we need a simple method to locate places quickly and easily … so we use coordinate systems (or grid systems). Many of us are familiar with this type of system because most city maps use the familiar “Battleship” or “Bingo” coordinate system (e.g. “G7”, where letters are used on the vertical axis and numbers on the horizontal axis, or vice versa). More technical maps tend to be part of a much larger grid (e.g. in Canada, the NTS – National Topographic System).
The Canadian National Topographic System uses the Universal Transverse Mercator Grid system (U.T.M.). This was developed as a military coordinate system and is used internationally. On individual map sheets, features are located by a six number code; the first three are always the “easting” (east-west or horizontal value); the second three are always the “northing” (north-south or vertical value). The first two numbers are given by the blue grid lines on the map. The third number is estimated imagining tenths between the blue grid lines.
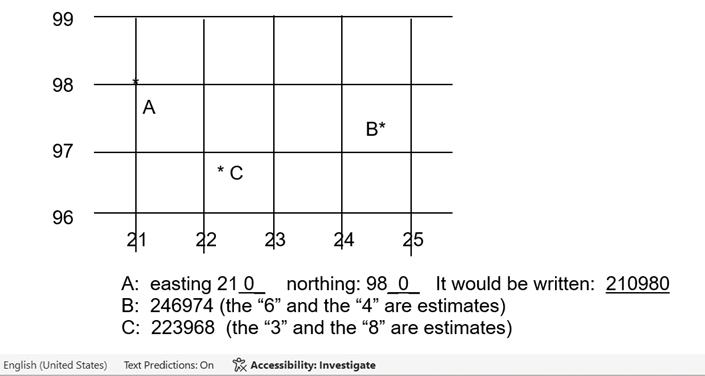
***NOTE: The first three numbers are always the easting (side-to-side); the last three the northing (top-to-bottom)
Lab 3
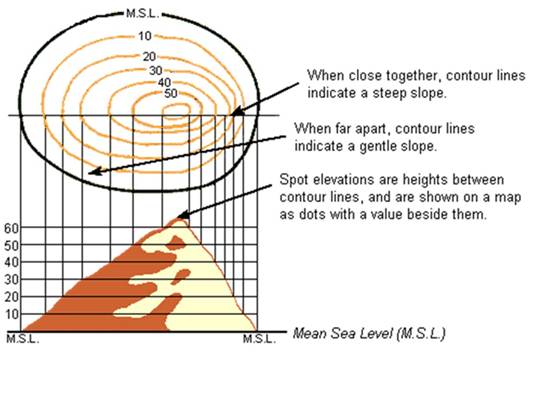
Cartographers most commonly depict the third dimension (height) on maps by the use of contour lines (those brown lines circling all over the maps). Computer techniques allow for rapid, accurate contouring from aerial photographs. On the ground, bench marks are placed at surveyed reference points to provide precise height information on metal plates. On large-scale maps, additional spot heights are printed, giving exact elevations at key points such as road intersections and hilltops.
A contour line is a line on a map that connects points of equal elevation above mean (average) sea level (s.l.).
- Every point on a contour line is exactly the same height – land on one side is all higher than the height represented by the line; land on the other side is all lower than the height shown by the line.
- The vertical difference (difference in height) between two contour lines is standardized on each map (e.g. 25 m, 50 m). This difference in elevation of neighbouring contours is the contour interval; it is always specified on the bottom margin of a map. Usually every fifth contour line is drawn more boldly in order to make it easier to interpret the map (this is done on your maps).
Note that on some NTS maps, contour lines and elevations are still given in feet not metres (not updated recently). Yours, however, have been converted to metric. When Canada “metricized” the horizontal scale of maps could simply be enlarged/reduced by computer to a metric-friendly scale (e.g. 1:50 000 = 1 cm to ½ km) from the old scale (1:62 500 = 1 inch to 1 mile). However the contour lines were actually already drawn at foot intervals. Each line has to be redrawn at new, metric intervals.
Properties of contours:
- contours separate land higher in elevation from land which is lower.
- contours are drawn at standard intervals; the contour interval is the same on any one map.
- all contour lines are drawn as if seen from directly above the landform.
- contours are continuous lines – they either enclose an area on a map or disappear off the edge of the map.
- closed contours always enclose higher ground. The only exception is when a special symbol is used to indicate a depression – depression contours, enclosing lower ground, are contours ticked in the direction of the depression:
Contours never cross each other and never split. However they may merge (but never actually touch) along a near vertical cliff.