
Atmospheric Circulation
Chapter 6
“You can hear the wind but can’t tell where it comes from or where it is going …”
John 3:8 (NLT)
**There is a video version of this lecture here: https://youtu.be/1zDnVwnHK0w
**The exam is based on the content in these notes, so please print them off to study from.
I. Atmospheric Circulation – Wind!
The atmosphere moves – we experience this as wind!
This fact is important because:
- energy is redistributed (e.g. from the tropics toward the poles)
- pollution (both natural and human-induced) is dispersed and moved around the globe
- global weather patterns are produced
- ocean currents are generated
Figure 6.1 demonstrates how atmospheric circulation – global wind patterns – move air (and aerosols/pollutants) literally around the globe. What happens in one location (in this case, the Philippines) does not stay in that location, but potentially affects the entire globe. While this example highlights a natural event (a volcanic eruption), human produced pollutants are just as easily transported, thus sulfides and nitrates produced in the U.S. cause acid rain the Atlantic provinces, aerosols emitted in China cause Arctic haze in the Canadian Arctic, etc.
Atmospheric circulation is categorized as (know these for your exam):
- primary circulation – general, worldwide patterns (e.g. westerly winds that dominate mid latitude regions, like North America)
- secondary circulation – regional circulation patterns (e.g. monsoons that are limited to South and South-east Asia)
- tertiary circulation – local winds. (e.g. anabatic/katabatic winds that affect a local area, like your neighbourbood)
Air pressure is key to understanding wind. Air pressure is the weight of the atmosphere, described as a force per unit area. The “weight” of the column of air above you is air pressure.
Air pressure and air density decrease with altitude. As you go up in altitude, there is less air above you and that air is much less dense. Thus there is less air pressure.
Air pressure is also related to air temperature. When air is heated, molecular activity (kinetic energy) increases, and the temperature rises. With increased molecular activity, the spacing between molecules increases, their density is reduced, and air pressure drops. Warmer air is less dense (or lighter) than colder air; it rises. And it exerts less air pressure.
Air pressure is related to water vapour content as well. Moist air is lighter because the molecular weight of water is less than the molecular weight of dry air. As water vapour in the air increases, density and air pressure decrease.
The result of all of this is that warm, humid air is associated with low pressure, and cold, dry air is associated with high pressure … more to follow.
Air pressure is measured by a barometer. Normal air pressure at sea level is 1013.2 mb (millibars). This can also be expressed as 101.3 kPa (kilopascals) or 29.92 inches of mercury (USA). On maps of air pressure, where places of equal air pressure are joined by lines, these lines are called isobars. If you are familiar with a contour map, where contour lines join locations with equal elevation, isobars are the same concept only joining locations with equal air pressure.
Note that closely spaced isobars on a map mean a large pressure change in a very short distance (a large pressure gradient) – strong winds. Widely spaced isobars on a map mean a small pressure change over a large distance (a small pressure gradient) – weak winds.
Air pressure “normally” ranges between 980 mb (low pressure) to 1050 mb (high pressure).
II. What is “wind”?
Wind is simply defined as the horizontal movement of air across the earth’s surface. Turbulence, cause by uneven surface and uneven heating, causes vertical downdrafts and updrafts as well.
Wind is produced by differences in air pressure between one location and another. Air flows from high pressure to low pressure.
Wind speed is measured by an anemometer (in km (kilometres)/h or m(miles)ph or k(knots)ph). The Beaufort Wind Scale is a more “experiential” way of categorizing wind speed based on what you might actually observe. The Beaufort Scale goes from 0 (calm) to 12 (hurricane force). The Wikipedia page has a great description/pictures for each stage on the scale.
Wind direction is measured by a wind vane. Winds are named for the direction they blow FROM. Winds are NOT named by where they are blowing to. This is important. And for some people counter-intuitive. Know this (for the exam…?)
- e.g. a westerly blows from the west toward the east
- e.g. a nor’easter blows from the north-east toward the south-west
For those of you who are interested, in biblical literature, the most deadly wind is the east wind. Why? Think about Israel. An east wind blows hot and dry, from the east, off the deserts of the Middle East (see Job 15:2, Hosea 13:15). West winds tend to be cooler and wetter, blowing from the west, off the Mediterranean Sea, bringing moisture and moderate temperatures.
- *See Figure 6.5, “A wind compass” 4CE; p. 148 (3CE, p. 138) for the “names” of the major winds.
A. Primary Circulation (Global wind patterns)
On a global scale, dominant wind patterns are the results of:
1. Pressure Gradient Force
 (Figure 6.8a, “Three physical forces…” 4CE; p. 152 (6.7a;3CE, p. 141)
The density of air (or air pressure) varies both vertically and horizontally. Vertically, air density (air pressure) decreases as altitude increases, because the earth’s gravitational pull upon air is weaker. The higher you go, the less dense – or the thinner – the air becomes (remember Chapter 3).
Horizontally, temperature affects density (air pressure).
Horizontal variations in air density within the atmosphere cause air to be pushed from areas of high pressure to areas of low pressure. (see the map to the right) Air always moves from HIGH to LOW pressure! Think about a balloon: you blow into it to create a higher pressure than the air around it; but if you let go of the stem, the high pressure air in the balloon will rush out!
- In a high-pressure area, air descends (it is denser/heavier than the air around it). As it sinks, it spreads out, moving along the surface toward lower pressure areas. High pressure areas are clear (more later).
- In a low pressure area, air rises (it is less dense/lighter than the air around it). As it rises, it pulls air toward itself, air converges. Low pressure areas are cloudy, often stormy (more later)
If the isobars are far apart (i.e. air pressure changes only a little bit over a large distance – a gradual pressure gradient), winds will be light. (see the map to the right)
If the isobars are very close (i.e. air pressure changes a lot in a very short distance – a steep pressure gradient) winds will be very strong. (see the map to the right)
2. Coriolis Force
(Figure 6.8b 4CE p. 152(6.7b; 3CE, p. 141))
On a non-rotating earth, winds would flow straight from high to low pressure. But, the earth is rotating quickly (believe it or not at 1700 km/h at the equator; 650 km/h at our latitude – it has to make one complete revolution every 24 hours). Thus, although the air may move straight in the atmosphere, from the earth it will appear to move in a curved path – the air really is going straight, but the earth is rotating underneath it (See Figure 6.7, “The Coriolis Force” 4CE; p. 150 (6.8; 3CE, p. 142)).
What you need to know:
- Air appears to deflect to the right in the northern hemisphere and to the left in the southern hemisphere.
- The Coriolis force (this deflection) is greatest at the poles and negligible at the equator.
The Coriolis Force is a difficult concept to understand. Read the section in your text to help you. the airplane example in the text may be particularly helpful. Don’t worry if you don’t totally understand why or how it works. Do know its effects:
- right deflection in N;
- left deflection is S;
- and its relative strengths at different locations:
- greatest at poles;
- negligible at equator
If the Coriolis force and pressure gradient force are exactly equal, the wind will blow parallel to the isobars; this called a geostrophic wind. This only occurs in the upper atmosphere. Near the surface, friction prevents this from happening.
Note, contrary to some popular pundits, the Coriolis force is NOT responsible for little twists in water draining from your sink or bathtub. Some people argue these twists go to the right in the N and to left in the S hemispheres. Such water does not travel far enough to be affected the earth’s rotation. Sink/tub swirls are the result of little eddies and currents in your sink (caused by the motion of your hands or something else) – not the Coriolis force. Some people who live on the equator make money from gullible tourists by demonstrating water swirling one way out of a basin just one side of the equator … then they hop to the other side of the road to show water swirling the other way out of a basin on the other side. In reality they cleverly twist the basins to give the desired effect. It is slight of hand, not Coriolis. Save your money!
Click here for a full discussion of this “urban legend.” If I ask you on an exam question about whether the Coriolis force causes water in your drain to drain to the right of left, make sure you answer that the Coriolis force has nothing to do with it! SO, if I ask you about whether or not the Coriolis Force affects the drain in your sink, you will know the correct answer, right???
3. Friction
(Figure 6.8c ; 4CE; p.152 (6.7c; 3CE, p. 141))
Land surfaces are relatively rough and resist airflow because of friction; it tends to slow wind speed up to heights of 500 m into the atmosphere.
You know this! If you want to get out of the wind, what do you do? Get behind something!
B. Global Circulation Patterns
The basic cause of atmospheric motion is the pressure gradient caused by unequal heating by insolation (solar radiation). The Coriolis force and friction then modify this motion.
*** Study Figures 6.10a and 6.10b, “Global barometric pressures …” (p. 154) AND “Geosystems in Action 6: Atmospheric Circulation” Figures 6.1a and 6.1b, “General atmospheric circulation model” – the globe figure (4CE, pp. 156-157; (Figure 6.11; 3CE, p. 146)). Know it inside-out! It will be on the exam in some form or other! Be prepared! ***
1. The Inter-tropical Convergence Zone (ITCZ) or Equatorial Low-Pressure Trough (dashed red line on Figures 10a and b, p. 154 and Figures 6.1a and b, pp.156-7)
The region of the Earth that uniformly receives high insolation all year long (intense solar radiation and consistent, 12 hour day length). The warming associated with all of this consistent energy creates lighter, less-dense, rising air – low pressure. At the surface, air then flows from higher pressure areas on either side of the equator, toward the equator. this converging air is very moist and full of latent heat energy. There is a lot of warm ocean surfaces for evaporation to occur. As it rises, it expands and cools, producing condensation – afternoon/evening clouds and precipitation. The equatorial region, then, is a low-pressure area.
During a typical day, water evaporates from warm, tropical oceans, air rises, and mid-late afternoon thunderstorms are common. Over the oceans, surface winds tend to be light because there is a weak pressure gradient and the air is rising upwards. Higher in the atmosphere, this rising air then moves in upper-air winds that flow north or south toward the Tropics and descends in high pressure systems in the subtropics (below).
This ITCZ region, with very light surface winds, is known as the doldrums – not a good place to sail because you can often be becalmed for long periods of time.
I spent some time in Singapore (1°N) … it’s true. Each day there was virtually no wind. And each began sunny, clouded up by noon — and poured rain from about 2 – 6 p.m. Then, as the atmosphere cooled, it cleared off by dusk.
Over continents this region extends large distances in summer; the intense radiation, evaporation and rising air gives rise to the seasonal monsoons (Arabic for season — discussed below).
Note that the ITCZ does move a bit north in July (when the sun is over the Tropic of Cancer) and a bit south in January (when the sun is over the Tropic of Capricorn).
2. N.E./S.E. Trade Winds (red arrows on Figures 6.1a and b, pp.156-7)
 Because there is low pressure at the surface in the ITCZ, air is drawn from north and south of the equator back, along the surface toward the equator. This creates reliable winds that blow from about 20-30°N and 20-30°S toward the equator. So, from about 20-30°N and 20-30°S toward the equator, relatively consistent strong winds blow from a high-pressure belt (subtropical highs [20°-30°N/S] – discussed next) toward the equatorial low-pressure belt (from the N.E. [in N] or S.E. [in S]).
In the days of sail, these were vital for trade — hence the name! They are most important over the oceans. Over continents, patterns are complicated by monsoon conditions (below).
3. Subtropical high pressure belts
The warm equatorial air cools as it rises, and flows north and south in the upper troposphere (6-10 kms). This cooler, dryer air sinks back to the surface at about 20° to 30° N and S latitude, creating subtropical highs pressure belts and weak winds. This results in hot, dry, clear weather. These areas, then, are dominantly high pressure (dry air), with very few clouds and thus little precipitation. Note that most major deserts (Gobi, Sahara, and eastern Australia) are in these latitudes.
In the oceans, well establish High Pressure areas persist at these latitudes. These move a bit seasonally (as the sun moves from the Tropic of Cancer to the Tropic of Capricorn). Notice the similarities on the January/July maps in Figure 6.10 (p. 154).
Models of climate change suggest these high pressure areas are intensifying, causing expanding desertification (desert-like conditions) in areas like North Africa, the SE USA/Mexico, and Australia.
These regions were called the “horse latitudes,” reportedly because Spanish conquistadors travelling to Central and South America in sailing ships were often becalmed for weeks and were forced to eat horses they were transporting across the Atlantic! Besides the doldrums (in the ITCZ), this is the location you may be becalmed as a sailor. This is important to know … great exam question!
Some of this descending air flows back to the equator; some flows toward the poles (see Figure 6.1b. “Cross section …” p. 157).
The typical rising-air-at-the-equator, sinking-air-in the subtropics, and returning-air-as-trade-winds forms what are known as Hadley cells (after the English scientist who first observed the pattern).
- See Figures 6.1a and b (6.11 in 3CE).
Be able to locate and identify (and draw if needed) this circulation pattern – a Hadley cell.
4. Mid-latitude Westerlies
 Some of the air that descends in the sub-tropical high pressure belts flow toward the poles. The effect of the Coriolis force in an upward spiral deflecting wind direction and air movement toward the right in the Northern Hemisphere and the left in the southern hemisphere. This creates a dominantly westerly (i.e. from the west) flow in both the hemispheres.
Westerly winds are strongest in the winter and diminish somewhat in the summer.
In these region storms (also called lows, cyclones, or depressions) tend to develop over oceans and move towards the northeast as vast spirals of cloud.
These storm tracks tend to move north in the summer (giving California nice sunny summers) and south in the winter (causing California heavy rains in winter).
Simple patterns are complicated by the friction caused by large air masses (northern hemisphere circulation patterns are much more irregular than southern hemisphere ones, because the north has more land).
These winds are very inconsistent, unpredictable and unreliable.
They do contribute to a strong north-south transfer of air, bringing thermal energy north and moving cooler air back to the tropics.
5. Subpolar Lows
In winter, low pressure cells dominate about 60-70 degrees S and N. In the north, in January, an Aleutian Low (in the North Pacific) and an Icelandic Low (in the North Atlantic) result in cool, moist weather. Winters on the north Pacific coast and in Northern Europe can be very wet.
These low pressure systems diminish in the summer, especially in the northern hemisphere, as the sun moves over the Tropic of Cancer.
6. Polar Easterlies
 Around the poles weak easterly flows appear to exist. In winter polar high-pressure cells often dominate, resulting in cold north-easterly flows (in the north) or south-easterly flows (in the south).
These appear to be related to the mid-latitude westerlies: warm, moist winds carry air north where it is cooled, descends over the poles, and flows south as polar easterlies.
6. High Altitude Winds
Winds in the upper atmosphere often move in different directions than at the surface! Because of the decreasing influence of friction, at high altitudes winds tend to be stronger and move more along the pressure gradient than across it (the Coriolis force). If the wind speed is high enough a geostrophic wind will result.
a. Upper Westerlies
In the upper atmosphere the dominant winds are westerly (deflected by the Coriolis force) outside of the ITCZ. They are strongest in the upper troposphere, 12-15 km above the earth with an average speed of 125 km/h; speeds of several hundred km/h are not uncommon.
Generally they are stronger in winter when temperature differences between tropics/mid-latitudes are greatest. (summer speed may be as low as 50 km/h).
The practical implication of this is that it is normally quicker to fly from Vancouver to Halifax than vice versa (especially in winter).
b. Rossby Waves and the Jet Stream
Around the poles, air appears to flow in a series of waves (Rossby waves, named after a meteorologist named Rossby!). On part of its track it carries warm air northward (ridges). Elsewhere it carries cold polar air southward (troughs). These often seems to become “fixed” in winter, perhaps because of the influence of the Rockies and Himalayas (causing very cold, dry winters to Alberta)
- See Figure 6.13, “Rossby upper-atmosphere waves,” 4CE, p. 160; (Figure 6.15; 3CE p. 150).
Along these waves, bands of especially strong winds (up to 490 km/h) – the jet stream – occur (Figure 6.14, p. 161). These relatively narrow bands of rapidly flowing air form in areas with very high pressure gradients, where cold, polar air and warm, mid-latitude air come in contact (see the zonal index, below). Jet streams are sometimes called atmospheric “rivers” because, like rivers, they are fastest in the middle
They are very important for air travel, both for speed reasons, and for turbulence reasons (they are very “rough”).
- Today’s location of the jet stream over North America is available here.
- For more global information and jet stream forecasts, click here.
A weaker, subtropical jet stream can occur where tropical and mid-latitude air converge.
These streams of extremely fast-moving upper level air were identified initially during World War II, but more extensively during the Korean War when jets began flying at high altitudes. Pilots heading west, across the Pacific toward Korea, discovered that though their air speed might be 400-500 km/h, their ground speed could be 0 km/h! They were, in fact, going nowhere! They were flying into a very strong westerly (from the west) jet stream.
It is, obviously, wisest not to fly in a jet stream (unless you’re traveling east, when it can really zip you along … very turbulently!)
Note that jet streams change with the seasons. Jet streams “follow the sun” in that as the sun’s elevation increases each day in the spring, the average latitude of the jet stream shifts poleward. As Autumn approaches and the sun’s elevation decreases, the jet stream’s average latitude moves toward the equator.
You may have noticed on weather forecasts they often talk about the jet stream … a big line on the weather map shaped like a wave – a Rossby wave, in fact. To the north of the jet stream is usually cold air. To the south warm air. (More about air masses in Chapter 8).
Along the jet stream itself, there can be nasty storm events as the cold and warm air collide – and move quickly. For instance, an Alberta Clipper is a fast moving low pressure storm system that is formed when cold, dry continental air mixes with warm, moist Pacific air, then “rides” the jet stream, bringing nasty weather to the eastern Prairies and central Canada.
One of the issues associated with climate change appears to be changes in the jet stream. This is leading to weather patterns tending to becoming stuck over areas for weeks on end. It also drives cold weather further south and warm weather further north. This change has been implicated in long seasons of cold/stormy weather in eastern North America, storms/floods in the UK, and extended hot/drought seasons in Australia and South Western USA. BBC News – Wavier jet stream ‘may drive weather shift’
c. The Zonal Index
Simply put, the atmosphere usually has two distinct air masses: a dome of cold air over each pole and a band of warm air around the middle. Where these two meet is referred to as the Arctic (or Polar) Front (this is where one jet stream almost always occurs); this retreats to high north in the summer and extends further south in the winter. Along this front pressure gradient differences are highest, causing high winds – the jet stream. This typically happens in a wavy line (Rossby waves).
The strength of these gradient differences is referred to as the zonal index; it tends to go from a strong to weak condition on a 4-6 week cycle which tends to cause 4-6 week cycles of cooler/warmer temperatures in mid-latitudes (us!). As it weakens it tends to create mid-latitude cyclones (discussed later).
C. Secondary circulation (regional circulation patterns)
Some regional wind systems change direction seasonally. These are often called “monsoons” — after the Arabic word for season (“mausim”). They occur in a number of countries around the world.
The strongest monsoons develop over southern and eastern Asia (although weaker monsoons exist over Africa, and even Australia).
The two key ingredients for the Asian Monsoon are a large land mass and a large ocean – namely southern Asia (Bangladesh, India, Nepal, Pakistan and Sri Lanka) and the surrounding Arabian Sea and the Indian Ocean.
See Figure 6.15, “The Asian Monsoons,” p. 161.
In winter, the Asia-European landmass is dominated by an intense, cold, high-pressure area (little insolation and heating) – cold and dry (Figure 6.10a). Consequently, winds tend to flow offshore toward the low-pressure ITCZ. Thus, in winter, cold, dry winds blow offshore FROM central Asia.
In spring, dry winds continue although the land begins to heat.
From April on, the pre-monsoon heat builds over the land. As the land heats, the air heats. And hot air … rises! With time and more intense heating, this will result in continuous rising of less dense air (as the land warms faster) over the land. Over Asia-Europe low pressure forms over the land, especially over North India and the Himalayas (Figure 6.10b).
 Meanwhile, over the oceans the air is relatively cooler and denser (remember water heats much more slowly than land does). So the ocean is now relatively high pressure.
To maintain the energy balance air starts flowing from the oceans (now relatively high pressure) to the land (now relatively low pressure thanks tot the land heating so rapidly).
This brings moisture-rich southwest winds across southern Asia – the ‘wet’ phase. From June-September, the Asian continent begins to super-heat and become a huge low-pressure area as the heated air rises. Meanwhile the Indian Ocean is under a subtropical high-pressure cycle. The temperature difference between the land and sea can be as much as 20°C – land temperatures in India can even exceed 45°C, while the surrounding water in the Bay of Bengal and the Arabian Sea remains in the low 20s.
As a result, warm, wet winds blow onshore. When these warm, wet winds reach the warm landmass and the Himalaya Mountains, the air rises, water vapour condenses, and precipitation results. This can result in devastating floods.
As the land and ocean begin to cool in late summer and into autumn, the land loses heat quicker than the ocean. The wind reverses during this ‘dry’ phase, becoming a north-easterly, blowing from the land, out to sea. These are dry winds, blowing from the land.
Human induced atmospheric changes (increased CO2 and methane) and the warming of atmospheric and sea-surface temperatures appears to be increasing causing more precipitation in some monsoon seasons and less precipitation in others … it’s complicated.
D. Tertiary circulation (local winds)
1. Sea and Land Breezes
- See Figure 6.16 “Land-sea breezes …” 4CE, p. 163; (Figure 6.17; 3CE p. 152).
In coastal areas, during the day, land areas heat quickly. This causes the air to rise, creating areas of low pressure. Adjacent sea areas heat more slowly, causing less atmospheric heating and high pressure remains. During the day, winds tend to blow on-shore, from the ocean onto the land (a sea breeze). Winds tend to grow in strength throughout the day as the land gets warmer and warmer; the water heats much more slowly. As evening approaches and the heating of the land decreases, the sea breezes tend to drop as well. Sea breezes are strongest mid-afternoon, and decrease toward evening. Sea breezes are also strongest in summer when the land warms most during daylight.
At night the opposite happens. The land cools quickly, becoming an area of high pressure. The sea cools slower, become – relatively – low pressure. Consequently at night winds often blow off-shore, as land breezes.
So, if you want to take sailing lessons – do so mid-afternoon (best winds!). Don’t take morning or evening lessons (like me!), when winds are lightest or non-existent.
You may also notice that coastal cities are cloudy during the day (moist air coming onshore) but clear out at night (dry air blowing from inland).
2. Valley and Mountain Breezes
- See Figure 6.17, “Pattern of mountain-valley breezes …” 4CE, p. 164; (Figure 6.18; 3CE p. 153).
During the day, ground in mountain valley areas is heated. As the ground heats quickly, air rises and breezes blow upslope. These are called anabatic winds. As air from the valley continues to be heated and rise throughout the day, warm, light breezes from the valley, up the slope develop.
At night, the ground cools quickly, cooling the air above it. As the air cools, it becomes denser and sinks. On a slope this means it flows downhill. This is called a katabatic wind. Thus at night, bitter cold winds may flow downhill in mountainous regions. If this cold air collects in a depression a very cold “frost hollow” can develop. Local examples include Chinook winds (Alberta), Santa Ana winds (California), and the mistral (France).
Note also that in the Northern Hemisphere, a slope with a southerly aspect (that is, the slope faces south), receives more solar radiation than a north-facing slope. Therefore, it’s warmer! In the north this great! Further south it may mean that south slopes are barren (too much insolation!) and only north slopes support vegetation.
Often there are warm, upslope winds on south-facing slopes, but cold, downslope winds on north-facing slopes.
- READ Focus Study 6.1, 4CE pp.166-167; 3CE, pp. 156-157.
III. Ocean Currents
Ocean currents are created by frictional drag of global winds. Wind pushes water into moving, creating currents. The currents, then, mirror the dominant wind patterns in each region. At the Equator, easterly trade winds drive surface water toward the west. This water “piles up” against the eastern shore of continents and is diverted toward the poles.
In the northern hemisphere surface currents move up the east coast of continents, cross the ocean in mid-latitudes, and circulating south along the west coasts. This large scale circular motion, called a gyre, move clockwise in the northern hemisphere.
In the southern hemisphere, gyres rotate counterclockwise, as water moves south along east coast (see Figure 6.18, p. 165).
Where surface water is swept away from a coast (for instance off the coast of Newfoundland), an upwelling current occurs to replace the moving water. This cool water is often rich in nutrients and thus these are some of the Earth’s best fishing grounds.
Overview this section so you understand their influence on global temperatures and climate. We do these in more depth in the other course.
IV. Natural Oscillations in Global Circulation
Multiyear oscillations in global circulation patterns affect air pressure, temperatures, and weather.
A. El Nino
El Nino, or the Southern Oscillation Warm Phase, is the most significant multiyear change in global circulation patterns. (“El Nino” is Spanish for ‘the boy child’ as these often occur around the time of Christmas).
The cold Peru current flows northward off South America’s west coast, joining the westward movement of the South Equatorial Current near the Equator (Figure 6.18). Normally there is high pressure off the coast of South America (where the water travels from) and low pressure in SE Asia (where this water travels to). This is part of the normal counterclockwise gyre in the South Pacific.
Occasionally, for unexplained reasons, pressure patterns and sea-surface temperatures shift so that there is high pressure over the western Pacific (off SE Asia) and lower pressure in the eastern Pacific (off South America). Trade winds that normally flow from east to west can actually reverse, flowing from west to east.
This can result in sea-surface temperatures in the eastern Pacific (off South America) increasing up to 8 degrees C, creating a surface pool of warm water that replaces the cold, nutrient rich water along Peru’s coastline. This change in normal nutrient-rich upwelling currents results in a loss of nutrients for the entire aquatic food chain off South America. This has serious implications for fish stocks – and the economies – in these areas.
As warm water spreads from the west Pacific and the Indian Ocean to the east Pacific, it takes the rain with it, causing extensive drought in the western Pacific (SE Asia and Australia) and rainfall in the normally dry eastern Pacific (South America). Australia has had some of its worst droughts in El Nino years.
Warm and very wet weather occurs along the coasts of Peru and Ecuador and into the Caribbean, causing major flooding whenever the event is strong or extreme.
El Nino correlates with droughts in Australia, SE Asia, India, and South Africa.
In western and central North America, El Nino generally results milder than normal winters and springs and wetter-than-average conditions along the southwest coast of California and the Gulf Coast between Texas and Florida. Eastern North America is not affected.
El Nino is associated with record-breaking Pacific tropical storms (hurricanes/typhoons), but lower than average Atlantic hurricane seasons.
B. La Nina
La Nina, or the Southern Oscillation Cool Phase, occurs when sea surface temperatures in the eastern Pacific cool below normal by 3–5 °C (La Nina means “the girl”). This condition is much weaker and less consistent than El Nino.
In contrast to El Nino, La Nina results in very wet weather in SE Asia and Australia, and drier than normal conditions in South America. Australia has had some its worst flooding in La Nina years. Ecuador, Peru, and Chile experience drought.
In India, a major rice producing nation, El Niño can weaken the monsoon that brings the rainfall the country relies on to fill aquifers and grow crops.
in North America, La Niña causes mostly the opposite effects of El Niño, above-average precipitation across much of the western and central regions. Some of central and eastern Canada’s coldest and snowiest winters have occurred during La Nina events. Meanwhile, precipitation in the southwestern and southeastern states, as well as Southern California, is below average.
This also allows for the development of many stronger-than-average hurricanes in the Atlantic and fewer in the Pacific.
C. Pacific, North Atlantic, and Arctic Oscillations
There are other multiyear oscillations in the North Pacific, North Atlantic, and Arctic … we’ll skip these in this course. They are interesting, but more detail than we need.
V. Wind Power (Focus Study 6.1)
Use of wind actually goes back centuries as windmills were used to drive pumps, grind flour, and perform other tasks.
In much of Canada, wind has tremendous potential as a renewable power source (although it also has its issues and its critics).
As of 2019, wind power generating capacity was over 13,000 megawatts (MW), providing almost 7% of Canada’s electricity demand (mostly in Ontario, Quebec, and Alberta). The Canadian Wind Energy Association has a strategy to grow to a capacity of 55,000 MW by 2025, meeting 20% of our energy needs.
- See Canadian Renewable Energy Association – Wind
- See also Wind power in Canada. There are good links at the end of this article.
- Canada Wind Atlas
In contrast, Denmark generates 48% of its electricity by wind power (Ireland 37%, Portugal 27%, Germany 26%, the UK 25%).
Worth reflecting on …
- Theologian Alister McGrath discusses – science is very successful at finding out certain things, but it has limits. When it comes to questions of meaning, does science have anything to say? What is the role of science? – YouTube. What do you think?
- “The basic theme of this book is simple,” writes Alister McGrath in a book that looks at the natural world from a Christian perspective. “It suggests that we reclaim the idea of nature as God’s creation and act accordingly, bringing attitudes and actions into line with beliefs. We have been entrusted, corporately and individually, with the jewel of God’s creation and given the responsibility of tending and nurturing it, before passing it on to others. We are like curators of the great art collection, who are accountable to posterity as well as to the present for our tending of its treasures. We must learn to appreciate and prize this entrustment, as perhaps the greatest privilege this earth can offer. And more than this: we must see nature as a continual reminder and symbol of a future renewed creation, a world that we do not yet know but believe to lie over the horizons of our human existence.”
(Alister McGrath, The Re-enchantment of Nature, page 184.)
How do you feel about that? Do you agree? Feel free to discuss these on the course discussion site …
To review …
Check out the resources at www.masteringgeography.com
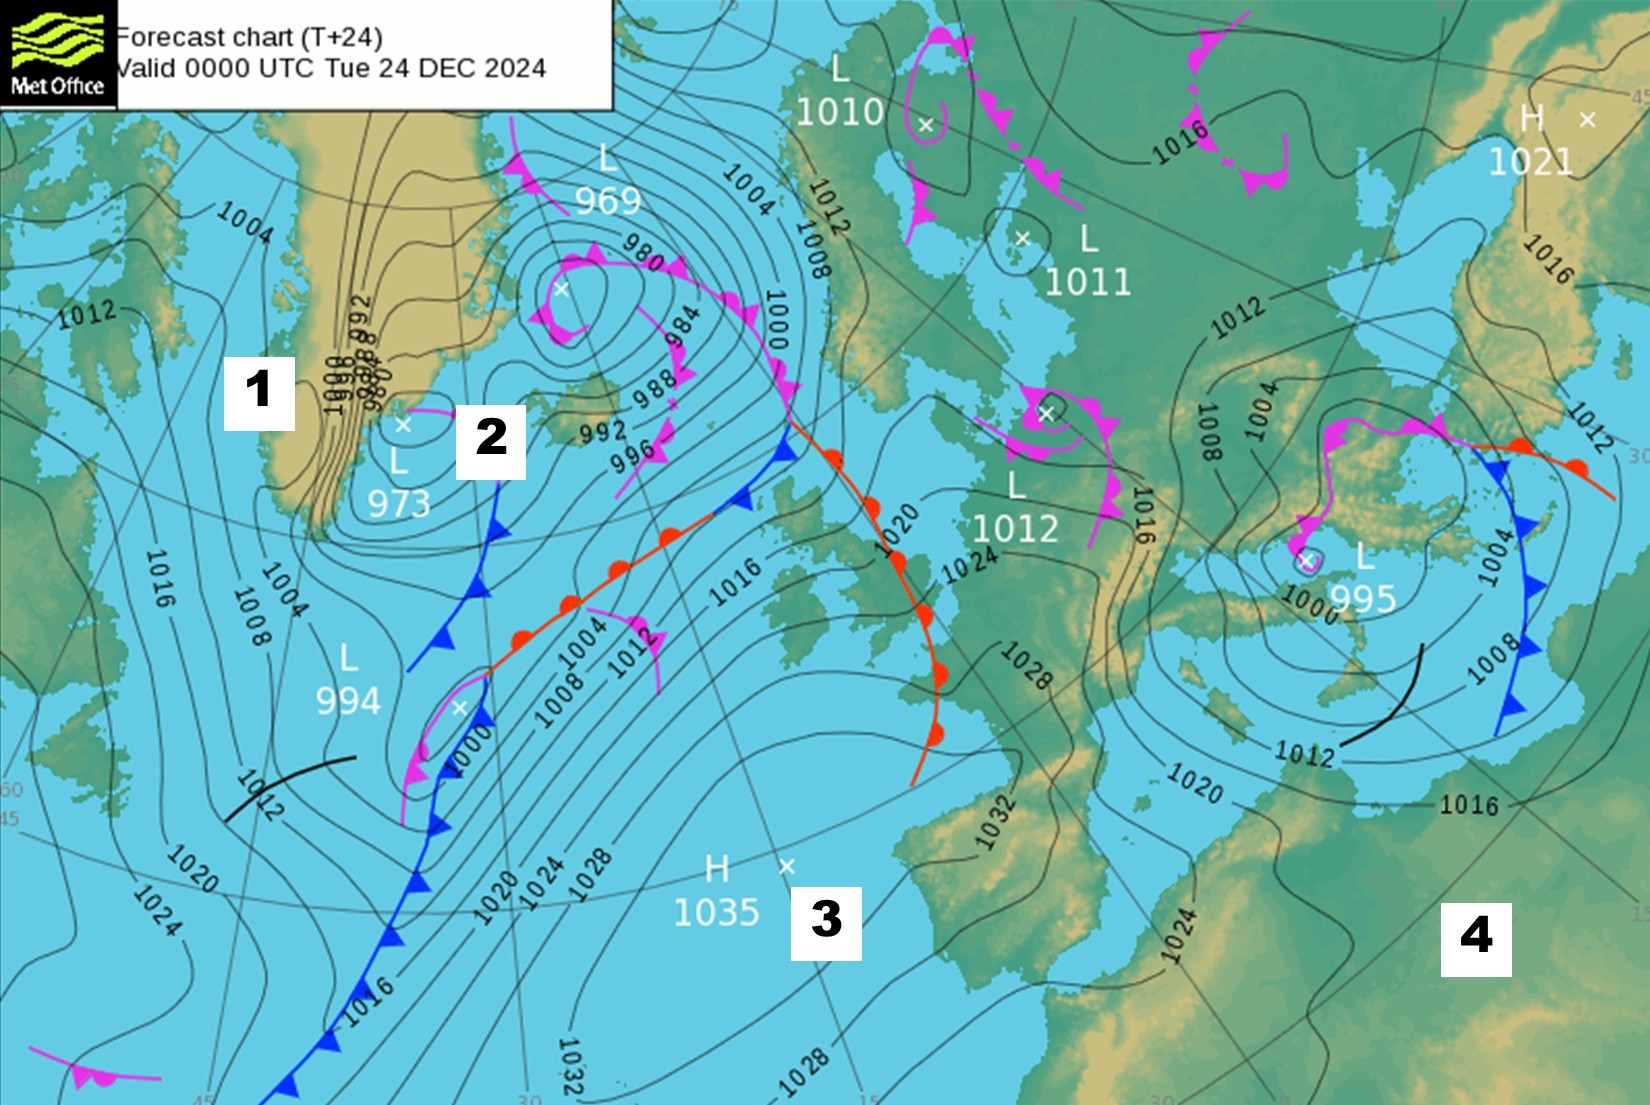
Also, check out the weather map below for a bit of review.
- Note that there is a strong pressure gradient – closely spaced isobars – from 1-2 – that implies HIGH winds
- Note wind will blow from HIGH pressure to LOW pressure – from 3 to 2 and 1 to 2
- Note that in North Africa, 4, there is hardly any pressure gradient. No winds 🙂
This page is the intellectual property of the author, Bruce Martin, and is copyrighted © by Bruce Martin. This page may be copied or printed only for educational purposes by students registered in courses taught by Dr. Bruce Martin. Any other use constitutes a criminal offence.
Scripture quotations marked (NLT) are taken from the Holy Bible, New Living Translation, copyright © 1996. Used by permission of Tyndale House Publishers, Inc., Wheaton, Illinois 60189. All rights reserved